Content warning: If you are a mathematician the words I use below are bound to be formally inaccurate, sorry!
Origins:
I saw this post by Sofinho, which I thought was interesting (you should check it out). To cut a long story short, it led me here:
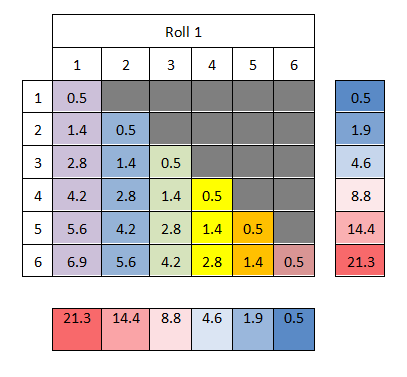
A D66 table with a probability gradient:
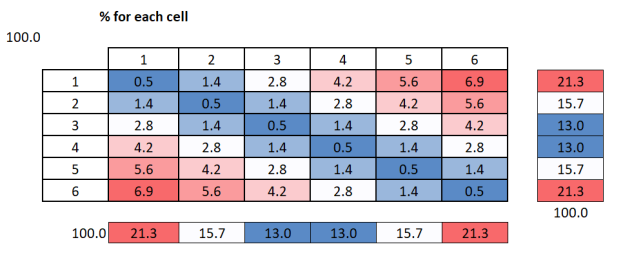
So the chance of rolling 1,1 is 0.5% and the chance of rolling 1,6 is 6.9%.
D6(6)6 Rules
- Roll 3D6
- Keep the highest & lowest rolls to make a D66 style dice
- Order these two dice how you like; or if that bothers you (perhaps you worry about an unconscious bias), order the two dice low to high if the removed middle roll is odd, else the other way round
Examples
- 6,5,1 becomes –> 1, 6
- 2,5,2 becomes –> 5,2
- 4,2,3 becomes –> 2,4
Below is the same table as above, but normalized so the lowest value is 1:
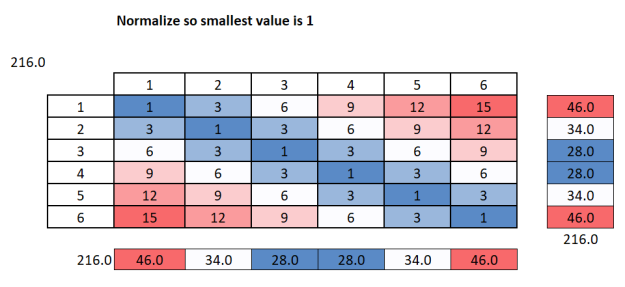
So rolling a 1,6 is 15 times more likely than rolling a 1,1.
Below is basically the same as above but where each cell is given with reference to % above/below a (standard homogeneous) D66 table, which is about 2.8% per cell:
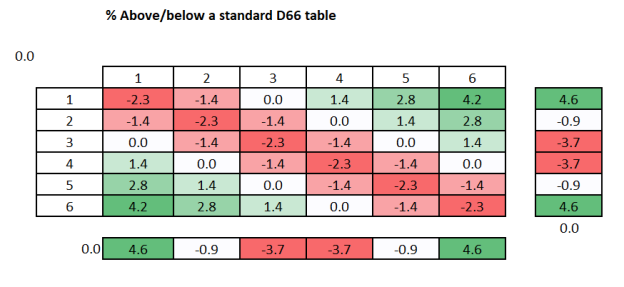
So cell 1,1 is 2.3% lower in probability than if this was a standard D66 cell.
Conclusions
- The diagonal ‘spine’ is disfavoured
- The top right and bottom left directions are more favoured (so, a 1,6 or 6,1 roll is 15 times more likely than any double)
- For probability, moving up/down gives the same result as moving right/left (so moving downward from 1,1 to 1,6 is the same as moving left to right from 1,1 to 6,1.
- Moving diagonally does not change the % odds, so rolling a 1,1 is the same % as rolling a 2,2 or 3,3 etc.
With this probability structure understood, you can create D66 random tables that are less homogeneous.
– – –
>> This is where you should stop reading, as I go (more) tangential below <<
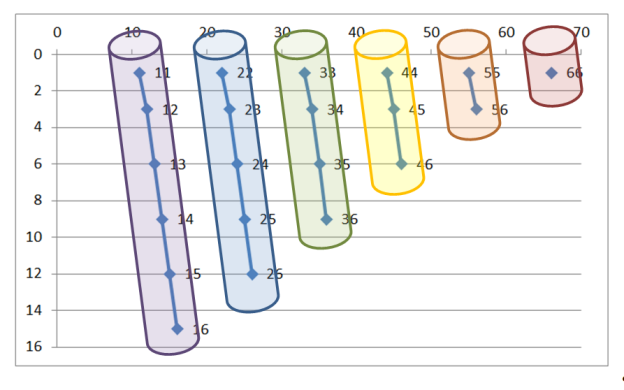
- For now if you ignore half the table (in this case ignoring the results above the diagonal spine) there appears to be a series of tiers (e.g. 1,1 to 1,6; 2,2 to 2,6; 3,3 to 3,6 etc.):
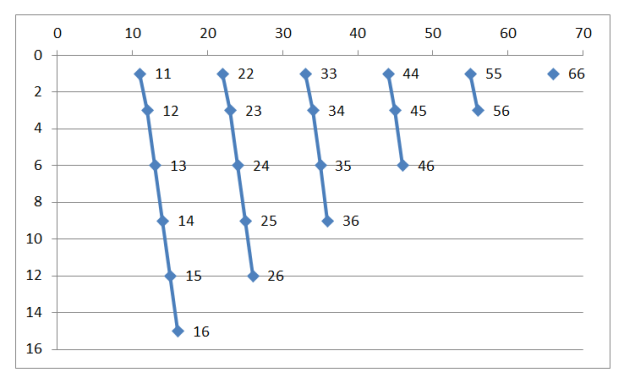
These tiers are not equal in size, each starts with a low % and increases as you move along the tier away from the diagonal spine. So the tier 1,1 to 1,6 is bigger than the tier 3,3 to 3,6 – I suppose there are also diagonal tiers, again not of equal size but in that case each step in the tier has the same %.
These sort of tiers made we wonder – can we use this method to make a series of tiered random tables?
City encounter/reaction tables
Examples are always best, so I’m going to consider a way this method could be used to generate random reaction encounters in a D&D type city.
In this case, I’m going to link the tiers to social class in the city, using this colour code:
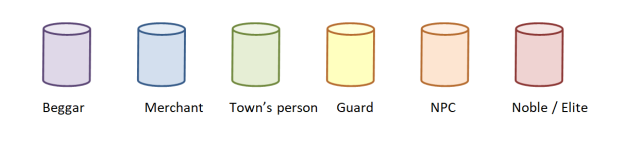
So the above tiers would be:
Again, for now I’m only considering the lower half of the table (so not the greyed out area).
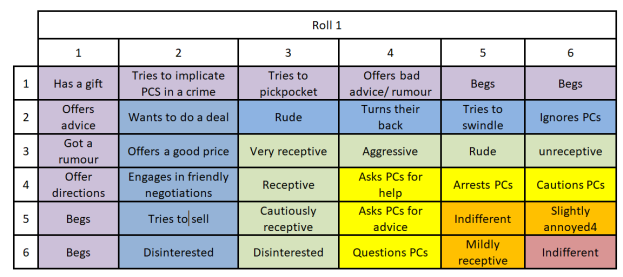
In this case the beggars/riffraff/lowest class tier interact most often with the PCs (21.3% of the time, i.e. whenever the first roll is a 1), whereas nobles rarely interact with the PCs i.e. only on a roll of 6,6 (0.5% of the time).
As for reactions, the nobles only have 1 reaction state, which in this case is probably indifference (at best).
However, the beggars/riffraff tier have 6 reactions states i.e. 1,1 (0.5% of the 21.3%) to 1,6 (6.9% of the 21.3%). So while there are 6 reaction states, 1,6 is the most probable reaction and so this should be the most common reaction state (e.g. asking for money) and 1,1, should be quite unusual (e.g. giving the PCs a gift or perhaps attacking them).
So perhaps the above structure makes sense in a dodgy market bazaar area (or slums), where beggars/riffraff are going to be out and about, and where other people including nobles might be out looking for something unusual/special (but on their guard, i.e. with 1 reaction state).
If you inverted the social structure (so the nobles have the 6 reaction states and are common), perhaps this makes sense in an upmarket retail area (or in the royal court) , where beggars/riffraff are going to be circumspect. Perhaps in the royal court the single riffraff state is a person intent on the redistribution of wealth.
Now if we bring in the rest of the table we blanked off earlier, you get the same tiers but in this case they also move left to right not just up/down. Perhaps the portion above the diagonal spine could be negative reaction states and below the diagonal spine could be positive reactions states e.g.:
42% 28.2% 17% 8.8% 3.2% 0.5%
OK, looking at this – that’s a lot of beggars/riffraff approaching the PCS in this city area, so perhaps swap town’s person for either beggars or for the merchants … ? That said, perhaps town’s folk are the decent kind of folk that stays well away from disreputable freebooters like the PCs.
Another option is to keep the greyed off area as a “no significant encounter” option.
Other uses …
The above is the first idea that sprang to mind. There must be other uses – tiers/kinds of random wilderness encounters, etc … or (probably for the best) just ignore tiers and populate the D6(6)6 table in a manner that takes account of where there probabilities are high/low.
I’m still not the RPG police …
If you don’t like this idea (and I’m just thinking this through) you don’t have to use it …
– – –
Me on DriveThru; at the moment I’m mainly pimping my procedural:
:: High Seas ‘Hex Crawl’ – In the Heart of the Sea,
:: Wilderness Hex Crawl – In the Heart of the Unknown,
:: Dungeon/network generator – In the Heart of the Delve & Dangerous

Warning: nerding ahead 🙂
> order the two dice low to high if the removed middle roll is odd, else the other way round
This would slightly alter the probability distribution, though.
For example, how do we get 35 or 53? Of course we need to roll a 3 and a 5, and the third die can be either another 3 (odd, 35), a 4 (even, 53), or another 5 (odd, 35). So 35 wins over 53 2 to 1.
I think it’s better – and quicker – to use spatial ordering, but some consistency is also needed for which die to drop in case of matches (for example, 353 or 535). I vote for reading left to right, and dropping the farthest one in case of matches, fwiw.
LikeLiked by 1 person
I think we are OK (you had me worried), because there are more 3,4,5 combinations:
3 3 5 *
3 5 3 *
5 3 3 *
3 5 5 *
5 5 3 *
5 3 5 *
3 4 5
3 5 4
4 5 3
4 3 5
5 4 3
5 3 4
* = 5,3
:O)
LikeLike
🤔 blimey, it looks you’re right!
LikeLiked by 1 person
I love how your mind works. You see an interesting tool and then keep turning it around and playing with it. I can very much identify– though in my case it’s probably more of an ADD thing. 🙂
There have been a number of times where I’ve looked for something other than a straight linear, pyramid, or bell-curve distribution and I can see how this U-shaped distribution could come in handy.
I particularly liked your tangential discussion and the city encounter example, and the fact that you could quickly determine the broad category of the encounter simply by rolling 2d6 and taking the lowest value.
It reminds me of a similar wound/hit location mechanic I’ve used for a while now where you take the lowest of 2d6 and apply it thusly:
1 Leg
2 Arm
3 Lower Torso
4 Chest
5-6 Head
The distribution is supposed to be proportional to the surface area (and is sometimes used by EMTs to determine things like burn coverage) but this chart is by memory so hopefully, I got it right.
Finally, I’ve still been chewing over a previous post you did on using hex flowers for social interactions. I’ve been working on a similar tool that players could navigate while trying to influence NPCs. I’m thinking it would have something like 3 axes along the lines of Trust, Sympathy, and Utility(?) or Opportunity(?) (I’m not 100% solid on the factors. I haven’t even decided the name of the last one.)
The idea is that the outcome of each of the PCs’ actions would be weighed along those factors which would move the NPC from one emotional/attitude state to another along the hex grid. At least that is how I think it should work out.
LikeLiked by 1 person
Ok – I’m not a math or probabilities person, but this is really bothering me that I am missing something fundamental here.
You first state a d66 (sixty-six sided die, 1.5% for any given digit) but go on to create a probability chart that appears to be for 2d6 instead. You state one of the of the combos below the chart as 1,1 so I’m going to go with 2d6 as the intended dice set to roll.
Each d6 has a 16.6% chance for any of the digits, therefore, a ‘1,1’ would have the same odds of 2.7% as ‘1,6’ or any other set in the result.
Moving to the 2nd chart, where a third d6 determines the digit order by odd/even (50% chance for either a 1, 3, or 5, or a 2, 4, or 6), I don’t see how that changes the odds at all.
@emarsk above gives an example of rolling a 3 and 5 as the outer digits and then *limits* the ‘controlling’ die to a 3,4, or 5 giving 35 better odds than a 53. Where did the third d6 die roll get limited to two odds and one even where they should instead be equal?
I did also consider if you were trying to emulate subsets of a d66 using 2d6 (11-16,21-26, etc) but again, I don’t see where the odds would change at all.
I’ve (re-)read the beginning of the post several times. My apologies if I’m being clueless here and I thank you in advance if you take the time to explain what I’m missing here.
— Beemer
LikeLike
Hi Beemer – thanks for the comment.
For a “traditional” D66 roll (which is really a D36; but people call it a D66 because it forms a 6×6 grid), all outcomes are equally the same, with each being 1 in 36 (so about 2.8%).
However, in this system you roll 3xD6 and *reject* the middle-most roll. This means that for example 1,6 or 6,1 is more likely than say 3,3, and you end up with a chart that has probs that look like the top one in this post. Essentially, as you move away from the diagonal ‘spine’ of the D66 table, the odds increase as more moderate rolls are rejected.
The additional (odd/even) rule is just a systematic way of deciding if you have rolled a high;low (e.g. 6,1) combo, or a low;high (e.g. 1,6) combo – you’ll see that @emarsk accepted that this was correct! So, this odd/even rule is not about changing the odds, just assigning placement in the D66 table.
Hope that helps!
:O)
LikeLike
Great post, super helpful.
When making a table. What factors would you consider when deciding between using a traditional d66 table versus your 3d6 reject the middle-most roll?
LikeLiked by 1 person
I’d use a traditional D66 table if I wanted all the outcomes to have the same chance of happening.
LikeLike
Have you ever looked at multiplying dice? The distribution is interesting.
LikeLike
I think I have. If you Google my “Field Guide to Random Table Design in RPGs”, I briefly cover it.
:O)
LikeLike